from PIL import Image
import glob #use it if you want to read all of the certain file type in the directory
imgs=[ ]
for i in range(596,691):
   imgs.append("snap"+str(i)+'.png')
   print("scanned the image identified with",i)

#starting and ending value+1 of the index that identifies different file names

imgs = glob.glob("*.png") #do this if you want to read all files ending with .png

#my files were: snap596.png, snap597.png ...... snap690.png

frames = []
for i in imgs:
  new_frame = Image.open(i)
  frames.append(new_frame)

#Save into a GIF file that loops forever

frames[0].save('fire3_PIL.gif', format='GIF',append_images=frames[1:],save_all=True,duration=300, loop=0)

#I found flickering issue with imageio and this method fixed it.-
-
Spectral characteristic of geomagnetically induced current during geomagnetic storms by wavelet techniques
Abstract
An EMF (electromagnetic field) is induced over an incremental area when magnetized plasma from sun interacts with the Earth’s magnetic field. This phenomenon delivers a Geomagnetically Induced Current (GIC) or induces geo-electric field at the Earth’s surface and in the ground. GIC and horizontal component of geomagnetic field have been studied with respect to various geomagnetic events. Particularly, we have studied four events. The first one is geomagnetically quiet period (5 October 2003), the second one is weak storm (21 October 2003), the third one is moderate storm (14 October 2003) and the last one is an intense storm (30 October 2003). By comparing the development of GIC during geomagnetic storms, we found that intense geomagnetic storms show higher development on GIC magnitude. The GIC during storm events is several times greater than that during the quiet day. AE index shows more activity in the event of 30th October than other events and GIC is also more in this event. This can be accounted to the greater geomagnetic disturbance in this case. The power ranges of higher intensity are seen at various time scales on different events. We have analysed GIC signal associated with four geomagnetic storms and found distinct periodicities at the time when H component highly perturbed. The characteristic of GIC signal demonstrates high variability with time without presence of continuous periodicities. Discrete wavelet transform (DWT) analysis reveals that whenever the geomagnetic field is perturbed, there will be high possibility of detecting GIC. The singularities present in GIC signal are due to the peak value of electrical currents system in the ionosphere and magnetosphere, and corresponding high fluctuations in H component. In this work, we explore the remarkable ability of wavelets to highlight the singularities associated with discontinuities present in the GIC.
Further reading at:
https://www.sciencedirect.com/science/article/abs/pii/S1364682617303851?via%3Dihub
-
HILDCAA‐Related GIC and Possible Corrosion Hazard in Underground Pipelines: A Comparison Based on Wavelet Transform
Abstract
High‐intensity long‐duration continuous auroral electrojet activities (HILDCAAs) are recognized as the continuous (duration >2 days) auroral electrojet activities (AE > 1,000 nT) caused by interplanetary Alfvén waves driving magnetic reconnection at the Earth’s magnetopause. This paper focuses on the study of geoeffectiveness of HILDCAA on the basis of associated geomagnetically induced currents (GICs) and pipe‐to‐soil voltage (PSV) observed in an underground pipeline at Finnish Natural Gas Station, Mäntsälä. In this study, 113 HILDCAAs with different interplanetary sources (72 corotating interaction region‐storm preceded, 29 interplanetary coronal mass ejection‐storm preceded, and 12 nonstorm) have been selected and their possible contributions in underground pipeline corrosion have been quantitatively compared by assessing GIC/PSV profiles for each of these events. In addition, the spectral characteristics of GIC during these events have been studied using continuous wavelet transforms. The Morlet wavelet has been applied to 10‐s modeled GIC data corresponding to each event to explore the main band structures and the periodicities found in GIC spectrum. GIC/PSV modeling is based on plane wave method and distributed source transmission line analogy between pipelines and electric circuits. HILDCAAs are found to drive a small‐amplitude, but continuous, fluctuation in GIC throughout the event duration of several days. This makes the cumulative effect of HILDCAAs in pipeline corrosion noteworthy. The spectral analysis shows that GIC possesses both short‐term, as well as continuous, power distribution with different periodicities. CIR‐preceded HILDCAAs are found to be more geoeffective while taking associated GIC and PSV into account. Possible physical explanations supporting the results have been presented.
Further reading at:
https://agupubs.onlinelibrary.wiley.com/doi/full/10.1029/2018SW001879
-
Field‐Aligned Current and Polar Cap Potential and Geomagnetic Disturbances: A Review of Cross‐Correlation Analysis
Abstract
Polar cap potential (PCV) is an important parameter used for determining what kind of interaction takes place between solar wind and magnetosphere. Highly energetic particles from Sun driven by solar wind constantly bombard with Earth’s magnetosphere–ionosphere system that results into a phenomenon like auroras, and major geomagnetic disturbances. Solar wind electron deposition determines the magnitude of field‐aligned current (FAC) and ultimately leads to PCV variation. Several studies found that increase in magnitude of IMF‐Bz causes an electric field of cross magnetosphere to increase, and it leads to increase in magnitude of ionospheric cross‐polar cap potential (PCV). Moreover, PCV was found to be a linear function of Vsw. In this research, we aim to study how field‐aligned current (FAC), for example, region 1 current and PCV, is related during different forms of geomagnetic disturbances. In all events, FAC and PCV are found to have corresponding fluctuations—especially at times of significant variation of IMF‐Bz (negative Bz interval) following the linearity of equation suggested by Moon in Moon (2012, https://doi.org/10.5140/JASS.2012.29.3.259). We found one‐to‐one correspondence between FAC and PCV. We did CWT analysis and found that FAC and PCV have more or less same spectral behaviors for each event considered. The cross‐correlation analysis shows a high and positive correlation between FAC and PCV at 0‐min time lag for all geomagnetic activity. The CWT analysis clearly supports the result of cross correlation between FAC and PCV. We found that FAC and Vsw, FAC‐B, and FAC and AE are also positively correlated with high‐correlation coefficient at lag 0 min for all geomagnetic storm. However, FAC‐Bz, FAC‐By, and FAC‐SYM (H) have varying correlation in different events. For a particular storm and substorm, the parameters Bz and By may not necessarily be varied with FAC in regular sequence but IMF (B) always show positive correlation with FAC for all geomagnetic activity. This paper presents a clear relation between FAC and PCV. This result will help to identify some of the outstanding issues in determining the causal mechanism of PCV variation, a crucial thing to understanding the coupling between the solar wind and M‐I system.
Further reading at:
https://agupubs.onlinelibrary.wiley.com/doi/full/10.1029/2018EA000392
-
Study of interplanetary parameters, polar cap potential, and polar cap index during quiet event and high intensity long duration continuous AE activities (HILDCAAs)
We observed the interplanetary datasets, polar cap potential (PCV), three different types of High Intensity Long Duration Continuous AE Activities (HILDCAAs) and polar cap index (PCI) during geomagnetically quiet period. On each event, we examine the interplanetary electric field ($Ey$), polar cap potential (PCV), polar cap index (PCI) and westward auroral electrojet (AL) indices. We found little perturbations in $Ey$ during the quiet event, but significant perturbations during HILDCAAs. In particular, non-storm HILDCAA showed more perturbations in $Ey$ compared to the other two HILDCAAs. Due to sporadic energy pumping into the magnetosphere, $Ey$ was perturbed even after the non-storm HILDCAA. From CWT analysis, we found highest power intensities to have periodicity of more than 190 minutes for quiet event, non-storm HILDCAA and CIR-preceded HILDCAA. However, the magnitude of the higher power intensity was different: 11 units for PCV and PCI in quiet, 9 and 14 units respectively for PCV and PCI in non-storm HILDCAA, 15 units for PCV and PCI in CIR-preceded HILDCAA, and 23 and 14 units for PCV and PCI during ICME-preceded HILDCAA. PCV and PCI clearly showed that higher power intensities are found in higher timescales. In contrast, lower and middle power intensities are found across all timescales.
Further reading at:
http://rjes.wdcb.ru/doi/2018ES000609-res.html
-
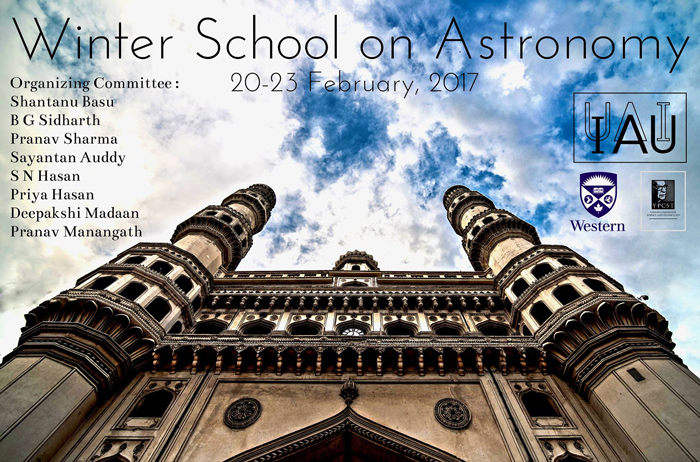
Winter School On Astronomy
Winter School on Astronomy was a four-day educational and cross-cultural rendezvous training and discussion with high-level experts. Invited lecturers taught various topics in theoretical and observational astronomy. Hands-on exercises helped equip the students with various tools in astronomy and data analysis. The last day also featured a research workshop on stellar clusters that introduced students to the latest developments in the field.

Winter School in Astronomy “My Experience”
Winter School on Astronomy
-
Download all Notes of M.Sc. Second Semester ( Solid State Physics) By Dr. VKJ
Click here or the link given below to download the notes given by Dr. Vinay Kumar Jha of the M.Sc. Second Semester 2016 ( Solid State Physics) .
Thanks,
-
QBASIC Program 2: To generate the upper triangular numeric pattern.
Program to generate the pattern
5 6 7 8 9
6 7 8 9
7 8 9
8 9
9CLS
tabposition = 0 ‘starting tab position
FOR i = 5 TO 9
PRINT TAB(tabposition); ’printing the tab position for each line
FOR j = i TO 9 ‘loop to generate pattern in each line
PRINT j;
NEXT j
tabposition = tabposition + 3 ’shifting the tab positon after each line to the right
NEXT i
ENDNow to generate any right fitting pattern like that consisting of different numbers, you can simply change the initial and final values of i and j.
**Happy Programming**
-
QBASIC Program 1: To generate the given Triangular Series.
Program to generate the pattern:
1
2 6
3 7 10
4 8 11 13
5 9 12 14 15CLS
x = 5
y = 5
a = 1
FOR i = 5 TO 1 STEP -1
p = x
q = y
FOR j = 1 TO i
LOCATE p, q
PRINT a
a = a + 1
p = p + 1
NEXT j
x = x + 1
y = y + 3
PRINT
NEXT i
END
-
From Atom to the Quantum Ordeal || Binod Bhattarai
“From Atom to the Quantum Ordeal”
- Binod Bhattarai
Sweet is by convention, bitter by convention, hot by convention, cold by convention, color by convention; in truth there are but atoms and the void.
– Democritus
Hello. Yes you, let’s schmooze for a while. How is the weather today? It’s sunny or cloudy? No? Ok so it is dark already. But how can you read something in dark? Lights are on? Oh, so you are lucky that the Maxwell’s Equations worked fine for you. Do not get surprised but there are few mega-cities in the world that celebrate darkness; electric. Oh you’re already in one? See I can predict at least few things. It’s really obvious that there is no proper way of telling the current state of your mind neither the time of the day nor the weather outside while you are here reading this. I won’t even surprise you if I say that I never knew you were going to read this article. (I hope you won’t take it as some task or challenge and run away Continue reading Post ID 369


